Before you start trying to figure out what tests you should do, I always recommend roughly graphing your data. This will also help you identify which of your columns are categorical or continuous.
Using the iris data, here is how I would categorize the data:

Now before you would have even collected the data, you would have had a question. Never forget your question! Stats can be overwhelming, but it can be even more so, if you forget your question. If you need a reminder of what a question, hypothesis, and prediction is, check out my post on writing here.
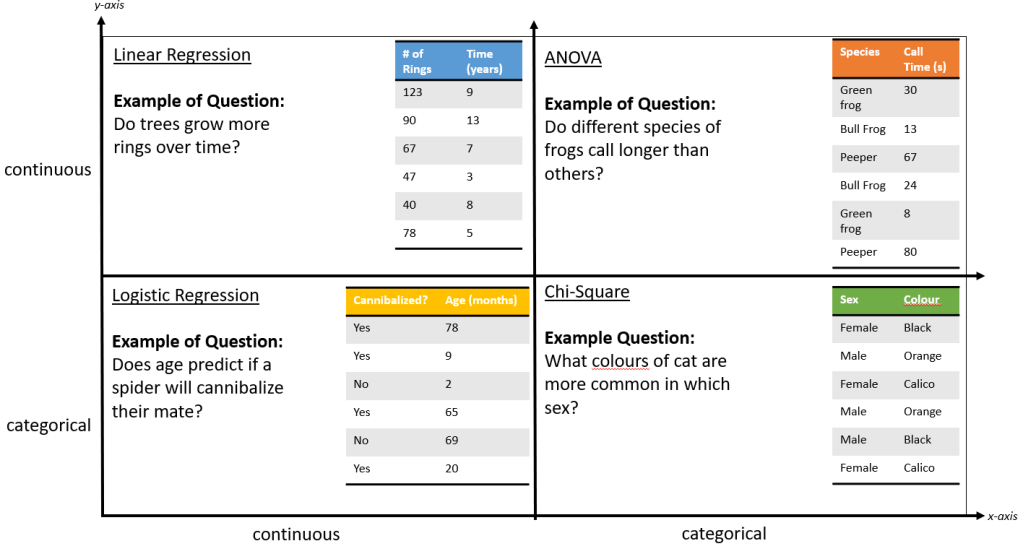
Now that you have your question, picking out the statistical analysis is easy! Here is a chart for the most common statistical analyses given the specific data:
Using the examples above, here are the codes for each of the statistical analyses in R:
- Linear Regression = lm(y~x, data=YOUR DATA)
- eg. lm( # of Rings ~ Time (years), data= TREE RING DATA)
- lm=linear model
- Logistic Regression = glm(y~x, family=”binomial”, data=YOUR DATA)
- e.g glm( Cannibalism ~ Age (months), family=”binomial”, data= CANNIBALISM DATA)
- glm = general linear model, this formula has an extra function, family, where you can let R know that you want this linear model to be binomial, or logistic (look here to see what a logistic graph looks like)
- ANOVA = aov(y~x, data=YOUR DATA)
- eg. aov(Call Time (s) ~ Species, data = FROG DATA)
- aov = anova
- Chi-square = chisq.test(data$y, data$x)
- e.g chisq.test(CAT DATA$sex, CAT DATA$colour)
- chisq.test = chi square test
If you want to read more on these specific tests and how to do them in R, Google is your friend!
