My file organization: Directory: “R Course”, Project: “Organizing Data”, File: “Summarizing Data”
For this course you will need to install and load the package “dplyr”.
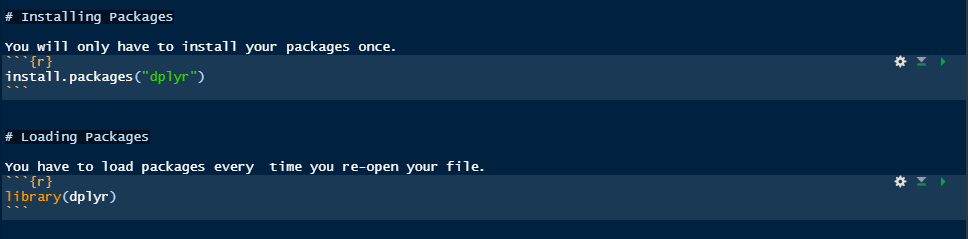
Don’t forget to run the code! If you don’t want to use CTRL+Enter everytime, Rmarkdown has a way to “run the chunk”:

The “dplyr” package allows us to do multiple functions at once by using this sign: %>%. Think of it similar to a plus [+] sign.
A summary of common calculations to summarize your data:
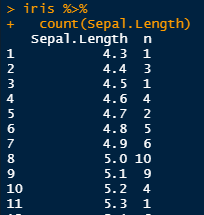
- count() = find the sample size for each in the specified measurement
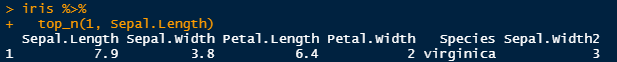
- top_n() =find the top value(s)
- summarize() = use calculations to summarize parts of your data
- mutate() = calculations of a column
A summary of the common functions to organize your data. You will need to use these functions if your want calculations for specific variables/columns/etc:
- select() = selects columns
- starts_with() = pick columns that start with specified
- ends_with() = pick columns that end with specified character
- rename() = renaming column, can be done similarly with select() within the code
- group_by()= grouping by certain variables
- ungroup() = use after group_by() to ungroup the variables
Ok let’s do some data summary!
Count() – How many plants had sepal length of the specified measurement. So for example 10 plants had a Sepal Length of 5.0!
top_n() – what is the longest Sepal Length.
Now we can show the smallest Sepal Length, by changing the “1” to “-1”:

summarize() = Let’s find the mean and standard deviation of Sepal Length and Width:

You can use a multitude of different calculations for summarize(), which you can check out here
mutate() = let’s transform our data with more calculations and create a new column with these calculations. You can mutate by numbers or by columns.

But what if I wanted to do all of these functions to specific variables, instead of the data overall?
Well this is where our organization functions can come into play.
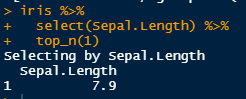
What if I want the top values only for Sepal Length and not the other information that came along with it? Well I’d select() just the Sepal Length column:
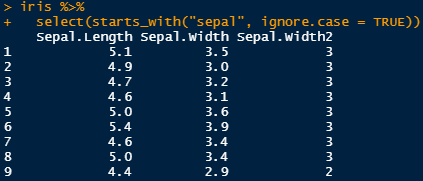
You can select multiple columns, or select columns with similar characters using starts_with() or ends_with():
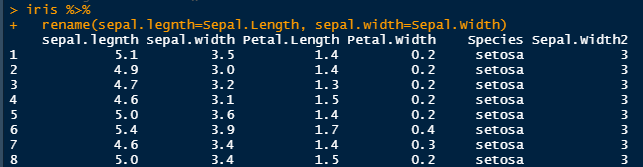
Speaking of letter cases, how about we rename the columns so we do not have to capitalize the letters when typing the into R!
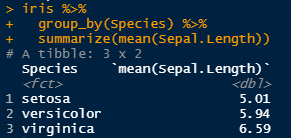
Last but not least lets try group_by(). Lets say you don’t care for the average of all of Sepal.Length in total, but instead want to know the average Sepal.Length for each species.
This is just the beginning to dplyr, but I hope this helps you start on the basics of data summarization. But check out this page on dplyr to find out more.
